From Waveform to Insight: A Compiler for Customer Intent
May 19, 2026

Every contact center sits on the same paradox: the most valuable signal in the business — why customers are actually calling — flows past in a medium (speech) that almost no downstream system can consume. Analytics dashboards speak in joinable rows and columns; conversations arrive as waveforms. The gap between those two representations is where containment strategies die, where staffing plans go stale, and where emerging issues incubate for weeks before anyone notices.
Topic Analytics is how we close that gap. And the useful way to think about it is not as a dashboard or a report, but as a semantic compiler: a multi-stage pipeline that lowers acoustic signal into a typed, clustered, labeled ontology of customer intent — in near real time, on every interaction, at contact-center scale.
A compiler takes a language humans write fluently but machines cannot reliably execute — loose, ambiguous, full of context only a reader can resolve — and lowers it, stage by stage, into symbolic instructions a machine can act on. Topic Analytics is the same idea, applied to the language humans speak most fluently of all: conversation. Free-form, discursive, full of digressions and repairs — and, until now, completely opaque to any database downstream of it. The pipeline lowers it into symbols a BI system can join on.
The problem, stated precisely
Contact center supervisors are under pressure to improve containment (deflect more to self-service), lift agent productivity, and protect CSAT. Each of those levers depends on a single upstream primitive: a reliable, current distribution of contact reasons. Without it, you cannot:
- Pick the right automation candidates — the topics with the highest volume and lowest variance in intent.
- Plan staffing and training against real demand rather than last quarter's call codes.
- Detect emerging issues while they are still faint, before a mis-priced SKU or a broken deployment becomes a CSAT cliff.
The incumbent answer — agent-selected disposition codes plus sampled manual QA — is slow, biased, and low-resolution. It answers "what did an agent remember to click after a call?" not "what is the population of customer intents right now?"
Architecture: a seven-stage pipeline
Topic Analytics is engineered as a purpose-built pipeline for contact-center interactions, rather than a general-purpose NLP toolkit bolted onto the side of the platform. Each stage is independently scalable and independently evaluable, and each stage's output is the next stage's typed input.
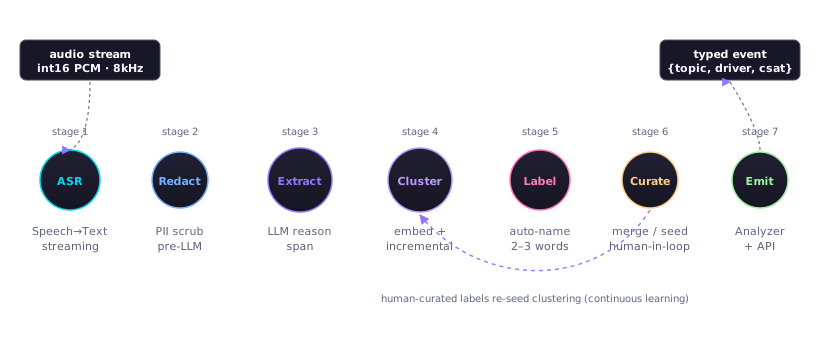
Figure 1. The pipeline. Stages 1–7 run per-interaction in near real time; stage 6 feeds a slower, continuous retraining loop back into stage 4.
Stage 1: Speech-to-Text transcription
Streaming ASR optimized for the phonetic and prosodic characteristics of contact-center audio — narrow-band telephony codecs, accented speakers, background noise, hold music. Because the caller leg and the agent leg are captured and processed as separate audio streams, transcripts are produced with speaker labels directly — no ML diarization model required to untangle who said what. The two streams are stitched back together with clean provenance on every utterance, which matters downstream: distinguishing the customer's words from the agent's is essential when we go looking for the customer's reason for contact.
Stage 2: Redaction
Before any transcript touches the LLM, it passes through a PII-aware redactor. Named entities, account numbers, payment credentials, dates of birth, and health data are replaced with typed placeholders (<CARD_NUMBER>, <DOB>). This is not just a compliance boundary — it is an information-theoretic boundary. Redacting tokens that would otherwise dominate attention weights (long digit spans, proper nouns) forces the extraction model to condition on the actual intent phrases, which improves topic coherence downstream.
Stage 3: LLM-powered contact-reason extraction
A purpose-prompted LLM reads the redacted transcript and emits a compact, canonicalized phrase that captures the customer's reason for contact — not a summary, not a sentiment, not an agent action. A flight-status call becomes "check flight delay status"; a billing call becomes "dispute duplicate charge". Producing a normalized reason phrase — rather than trying to cluster the full transcript — is what makes the rest of the pipeline tractable.
Stage 4: Dynamic clustering
Reason phrases are embedded into a dense vector space. Clusters are discovered dynamically — the number of topics is not fixed in advance — using an incremental clustering algorithm that assigns each new point online as it arrives, spawns a new cluster when no existing region is a sufficiently good neighbor, and lets clusters evolve as more data accumulates. Because the algorithm is incremental rather than batch, it is what makes the "near" in near real time possible: we are not re-running a batch clustering algorithm over a historical window on every tick, we are updating the topic space as each interaction lands. (An earlier generation of Topic Analytics was built on a batch clustering algorithm; the NRT system is not.) This is the stage that lets a new product launch or a novel defect manifest as a new topic within hours, not quarters.
Stage 5: Automatic topic labeling
Each cluster is named by a second LLM pass that reads a sample of its member phrases and produces a 2–3 word human-readable label (Flight status, Refund request, Baggage help). Labels are constrained to be noun-phrase-shaped and terminology-aware — the model has context about the customer's industry so it favors domain language over generic language.
Stage 6: User-centric topic customization
AI-generated topics are a starting point, not an endpoint. Admins can seed pre-defined topics at configuration time (typed in, or uploaded as CSV/XLSX), rename AI-generated labels, and merge clusters that the model split too finely. Those human edits are first-class signals: they flow back into the clustering stage as soft constraints on the next run. This is the difference between "the AI is wrong, retrain it" and "the AI learned what your business calls that thing."
Stage 7: Continuous insights
The final stage is the one that makes the rest useful: emitting topic assignments as typed fields on every interaction, available in the Analyzer dashboard and over the API as custom report columns (Topic Name, Contact Driver). This is where the pipeline re-enters the BI world. You can now GROUP BY topic and ask the real questions: which topics have the worst CSAT? the longest AHT? the steepest week-over-week growth?
The loop is the product. A one-shot topic model decays the moment the business changes. Topic Analytics is explicitly designed as a closed loop: human curation in stage 6 becomes training signal for stage 4, which changes the labels stage 5 generates, which surfaces new topics to curate in stage 6. The dashboards are the readout of a system that is always learning the shape of your demand.
A seismograph, not a thermometer
The second metaphor that is useful here: Topic Analytics is a seismograph, not a thermometer. A thermometer reports a scalar — call volume is up, CSAT is down — and by the time a thermometer reading becomes alarming, the event has already happened. A seismograph picks up weak signals spatially distributed across a surface and lets you see the tremor where it originated, long before it becomes an earthquake.
Because every interaction is labeled, not just a sample, the system can detect cluster-level anomalies: a topic that did not exist last week, a topic whose handle time doubled overnight, a topic whose CSAT collapsed on a specific queue. These are the faint tremors — the single-digit percentage shifts in the tail — that predict the headline incident.
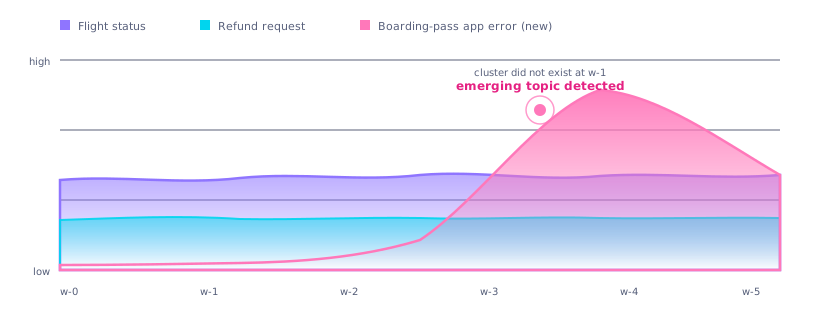
Figure 2. Known topics track their baselines; a novel cluster — call it "boarding-pass app error" — appears at week 3 and spikes at week 4. Topic Analytics names and surfaces it while it is still small, not after it tops the volume chart.
Why the embedding space shape matters
The design choice that carries the most weight is actually stage 4: incremental, online clustering on extracted reason phrases, rather than classification into a fixed taxonomy. The implication is worth stating plainly.
A fixed-taxonomy classifier is a decision about the world frozen at training time. When a new SKU launches, when a regulatory change creates a new category of call, when two previously distinct topics merge because the business process unified — a classifier cannot tell you, because it does not have a label for the thing it is seeing. It will quietly bucket the new calls into the nearest existing class, and the dashboard will continue to look normal.
Incremental online clustering is the opposite. Each new reason phrase is compared against the current cluster structure as it arrives; points that are not a sufficiently good fit for any existing region are allowed to remain unassigned until enough of them accumulate to form their own. When that region crosses the threshold, a new cluster is born, stage 5 names it, and it starts producing dashboard readings — without any offline retraining step. The system's ontology tracks the business's ontology, on its own.
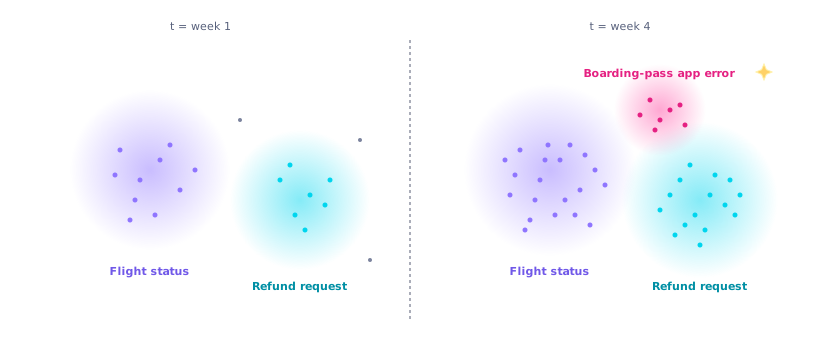
Figure 3. The same embedding space, three weeks apart. A new high-density region crosses the cluster-birth threshold and gets named automatically. A fixed-taxonomy system would have silently buried these calls in "Other."
What this looks like at the edge — the surface area
Inside the product, the compiler's output shows up in three surfaces:
1. The Topic Analytics dashboard
The primary UI — the one that ops leaders live in — is organized around the questions the pipeline was built to answer. Highest interaction volume. Longest average handle time. Highest and lowest CSAT. Top five topics by trend. Trending-topics table with per-topic sample-contact drill-down, filterable by queue and time window, refreshable on demand. This is the readout.
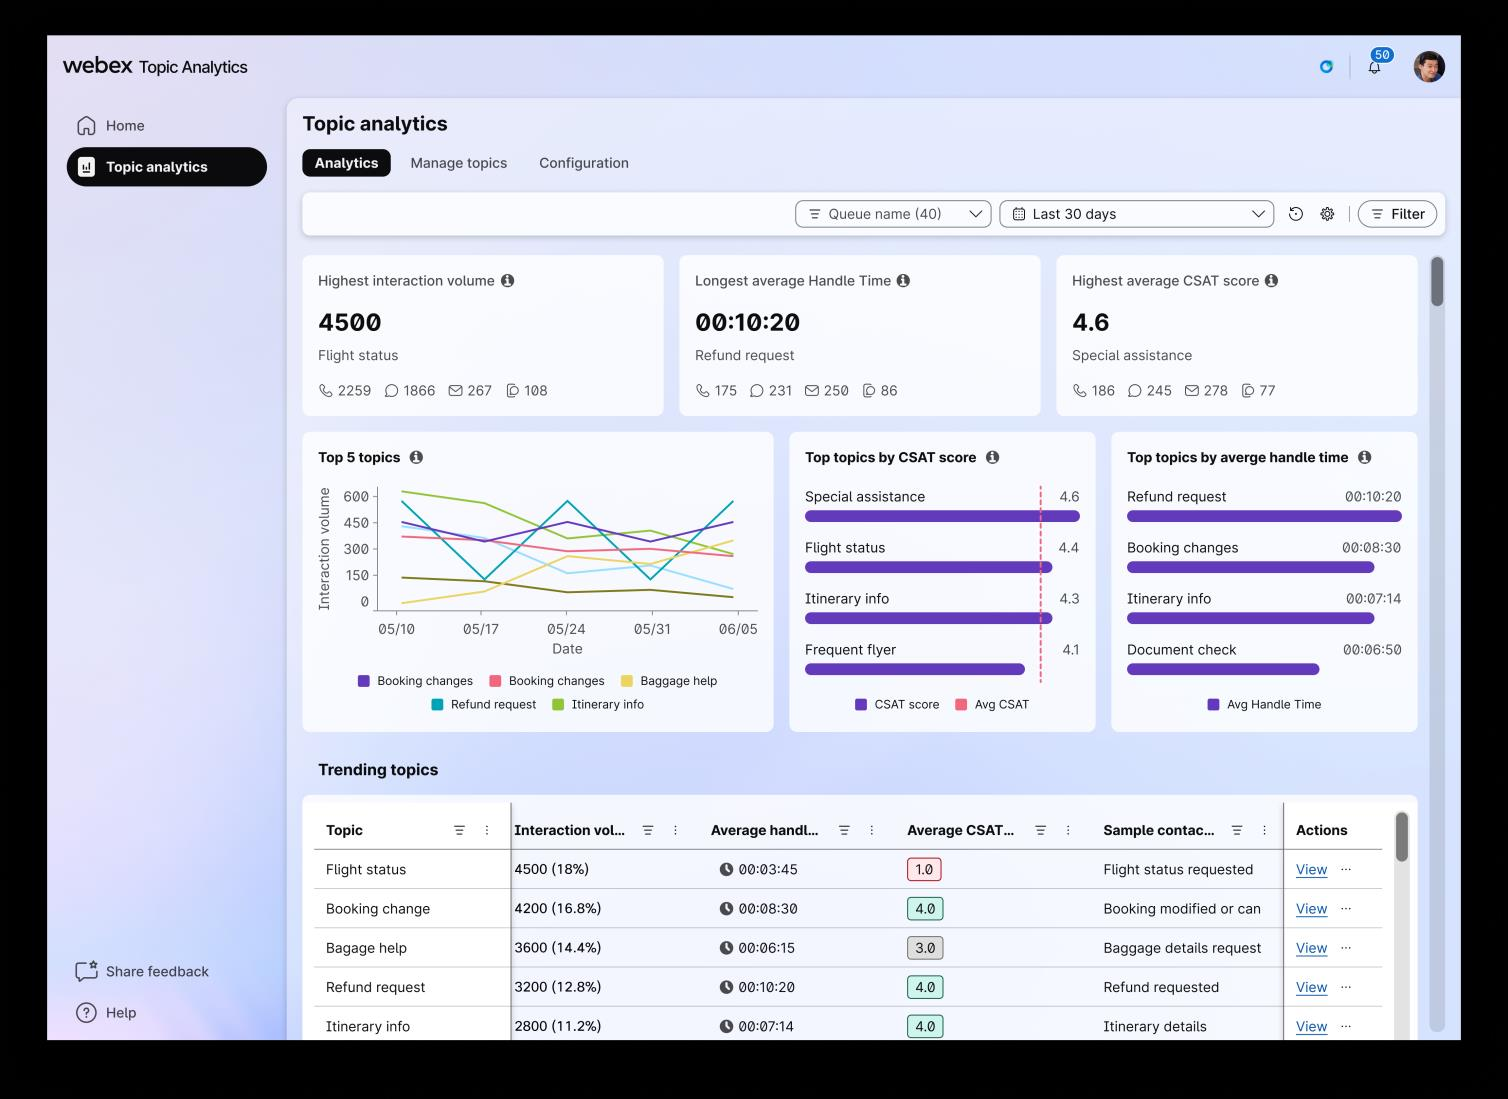
Figure 4. The Topic Analytics dashboard. The entire compiler stack exists to make this view possible — every card and column is a GROUP BY topic away from the raw interaction stream.
2. Topic drill-down
For any single topic you can pivot into that topic's world: its volume curve over time, its channel mix (voice / chat / email / SMS), the full list of associated interactions, and — crucially — the actual transcripts. The compiler can be trusted, but you can always inspect what it compiled.
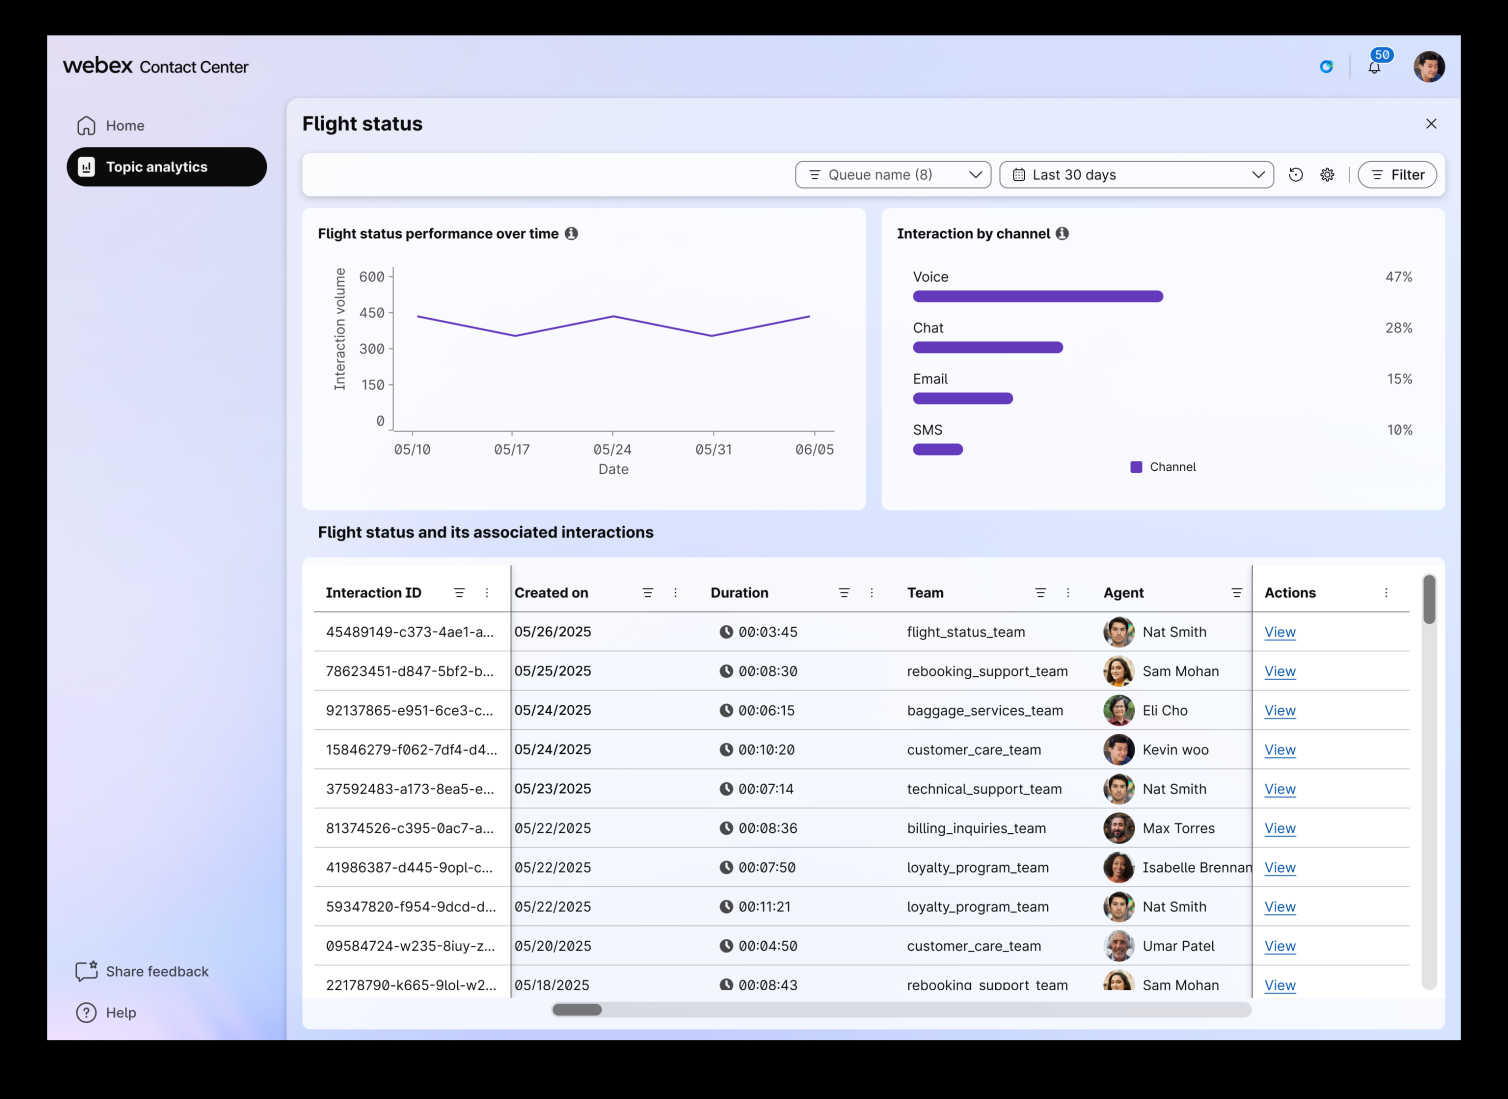
Figure 5. Topic drill-down. Every aggregate statistic is traceable back to the individual conversations that produced it — the compiler's output is always inspectable.
3. Analyzer + API
Two new custom fields — Topic Name and Contact Driver —
are exposed as first-class columns inside the Analyzer reporting engine and
over the public API. The same fields that power the native dashboards are
available to your existing reports, your data warehouse, and your
BI stack. The output of the pipeline is not a walled garden; it is a join key.
// Example: join your existing interaction warehouse to Topic Analytics output
SELECT
  t.topic_name,
  COUNT(*)                            AS interactions,
  AVG(i.handle_time_s)              AS avg_aht,
  AVG(i.auto_csat)                  AS avg_csat,
  COUNT(*) FILTER (WHERE i.contained) AS deflected
FROM   interactions i
JOIN   topic_analytics t USING (interaction_id)
WHERE  i.created_at >= '2026-04-01'
GROUP BY t.topic_name
ORDER BY interactions DESC;
That query — a week of contact-center demand, sliced by intent, with automation
and CSAT signal attached — is the one an ops leader could not write at all
before, because the topic_name column did not exist. The entire
pipeline is the machinery required to make one join key meaningful.
The engineering problems this actually solves
Cold start
A clustering system needs data before it can cluster. Most tenants do not want to run blind while the model learns what their calls are about. Pre-defined topics solve this: admins seed an initial topic list at configuration time (typed or uploaded as a CSV/XLSX), and those names are matched against interactions from day one. AI-generated topics accumulate alongside the pre-defined ones, and the pre-defined list provides anchors that stabilize the embedding space while the long tail is being discovered.
Label drift
LLM-generated labels are a moving target — the same cluster can get named "Refund request" one day and "Request for refund" the next if you are not careful. The system pins labels to cluster identity, not to generation runs, so the same cluster keeps its name across re-runs unless an admin renames it (which then becomes the pinned label, overriding the AI).
Long-tail topics
In a realistic contact center, the distribution is heavy-tailed: the top 20 topics are 80% of volume, and there are thousands of rare intents in the tail. Incremental online clustering is well-suited to this — it will form a cluster for a rare intent once enough related points have arrived, and leave individual oddities unassigned until they find neighbors. The tail remains inspectable without drowning the dashboard.
Cross-language support
The April–June 2026 release extends the pipeline to multi-language voice interactions and to digital channels (chat, email, SMS) — including AI-agent interactions, which close the loop between automation and the analytics that tell you whether the automation is actually working. The architecture accommodates this because every stage from redaction onward operates on text in a language-general way, with only stage 1 (ASR) and the extraction prompt in stage 3 needing to be language-aware.
Where this goes next
The roadmap telegraphs the ambition. Shipped in Q1 2026: near real-time discovery and pre-defined topic names. Shipping this quarter: multi-language voice, digital interactions, and AI Agent interactions. On the horizon: topic-to-AI-agent creation — the system identifies a high-volume topic with low variance in intent, and offers to generate an AI agent scoped to that topic. Topic themes for hierarchical organization. Topic insights for automated narrative over the trend data.
That last one — topic-to-agent — is the closing of the biggest loop in the contact center. Today, Topic Analytics tells you which calls are the best candidates for automation. Tomorrow, it builds the automation. The compiler stops describing the program and starts writing it.
Every contact center has always had its reasons-for-contact. They were just encoded in a medium — audio — that no dashboard could read. Topic Analytics is the translation layer: it lowers conversation into a joinable fact, and it does so continuously, on every interaction, in the business's own language. The dashboards are downstream. The pipeline is the point.
About the authors

Francis Kurupacheril is a seasoned technology executive and product strategist with over 27 years of experience delivering transformative AI and SaaS innovations across enterprise and consumer platforms, and serves as Director of Product Management at Cisco, where he leads the company's GenAI and Language AI strategy for the Webex portfolio.
At Cisco, Francis has architected and operationalized a multi-layered AI platform powering over 23 million meeting summaries and over a trillion LLM tokens processed. An expert in LLM productization, responsible AI, and agent-based architectures, Francis has scaled AI systems with multi-model support (OpenAI, Claude, Cisco-native models), achieving over 5x cost efficiency in key use cases. He has overseen delivery across AI-driven collaboration features, semantic graph search, topic analytics, and multi-modal assistants, impacting daily productivity for millions of enterprise users. His initiatives around agentic collaboration platforms are positioning Cisco as a trusted AI partner for government and regulated industries.

Jason Vaccaro is a Software Engineering Technical Leader for CollabAI. He has led the Topic Analytics project for the last two years. He has been at Cisco for four years and JP Morgan Chase & Co for four years before that. Jason graduated from Columbia University with a bachelor's in computer science and a concentration in mathematics.
At Cisco, Jason leads application development on AI-centered projects. He is particularly passionate about building distributed systems that scale, cutting infrastructure costs, and improving observability. Jason mentors junior engineers to promote their professional development and boost team velocity. He facilitates group discussions and brainstorm sessions to foster collaboration and improve design decisions.